

A team goes back to the spreadsheet, the notebook or WhatsApp when the new system takes more work than the old way on the task it does every day, not because people resist change. Adoption is decided on the screen of the most repeated action, in what each role sees and in a rollout done alongside the team, and it is measured after launch by the work done in the system, not by logins. At Fitness Academia, the client created all 15 user accounts on its own and entered its targets through December inside the tool.
Why the team goes back to the spreadsheet, the notebook or WhatsApp#
A team goes back to the old way when the new system takes more work than the spreadsheet did on the task people do every day. Each person compares, without noticing, the time it takes to jot something in a notebook and to record it in the system, and keeps whatever costs less. So abandonment is rarely resistance to change, and almost always a time calculation the system lost.
Any business owner has lived this story. The system arrived, there was training, and a few months later orders were back in the notebook, targets were back in a spreadsheet and documents were going around on WhatsApp, which is how most Brazilian companies message each other. Business owners tell us this in short form, "the notebook wins", or as an outburst: "I hate the word adaptation".
The usual reading is to blame the team, but the research points at the system. In 1989, researcher Fred Davis published two studies in MIS Quarterly with 152 users of four programs, measuring how useful and how easy each person found the system. Both tracked with the use people reported, but usefulness weighed more in both studies, and the analysis suggested that ease of use works mainly by making the system more useful. In operational terms: people use the system that helps with their work, and an easy screen matters because it keeps that work moving.
The fear of switching is real too, and it shows up before the system exists. An audit firm that is now our client brought it up in one of our first conversations, while it was still comparing proposals: "maybe not the way we do things, but the interface will change, and that makes me a bit anxious too". The new system has to give that time back in the first weeks, on the task that repeats the most.
The screen of the task that repeats decides whether the system stays#
Adoption is decided on the screen of the action the team repeats dozens of times a week. One extra field, one extra scroll or a bit of typing that did not exist before, multiplied across a whole week, weighs more than any new feature. That is why it is the first screen to design with the people who use it, and the first one to test against real work.
We are building, for an audit firm, the custom software that replaces the system they have used for years. About one module of the old system, the person who created it was blunt: "it got very bureaucratic", with "a lot of repetitive fields". For another part of the work, the request was for the system to carry the result of one step into the next on its own, "otherwise you'll have to go into window after window".
Our prototype got criticized too. In a validation session, faced with a date picker that made people step forward month by month, the answer was: "it would be easier to type it than to keep searching here". Someone who already knows the date by heart was losing time hunting through a calendar.
What we changed in the prototype during modeling follows the same rule. Checking off each account, the most repeated action in an auditor's week, sat in the seventh column of the table, past a horizontal scroll, and became the first column, pinned, with the click target lined up on every row. The account code, which was typed by hand and sometimes came out wrong, became a choice from a searchable list. And a flag that lived in a toggle separate from the content stopped being a step of its own: it became a consequence of the content being filled in, because the loose toggle produced groups that were flagged and empty, which went into the report as blank sections.
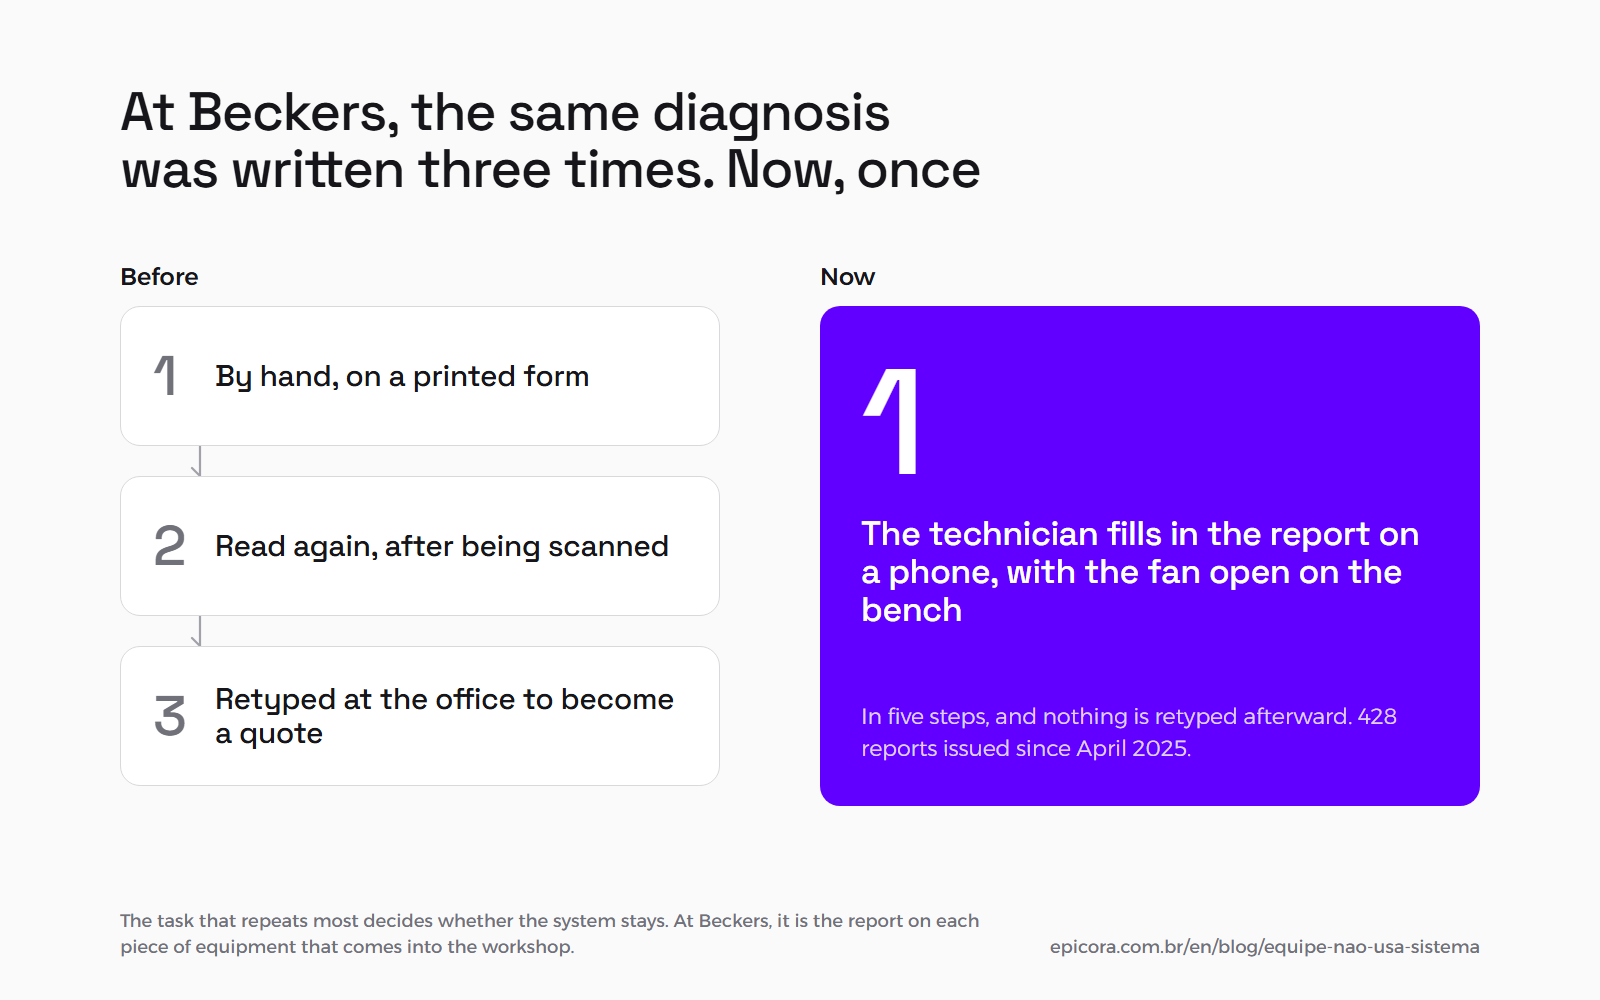
At Beckers, which repairs industrial fans, the task that repeats is the report on each piece of equipment that comes into the workshop. Before, the same diagnosis was written three times: by hand on a printed form, read again after being scanned, and retyped at the office to become a quote. Today the technician fills in the report on a phone, in five steps, with the fan open on the bench, and nothing is retyped afterward. The app has been part of the workshop routine since April 2025 and has issued 428 reports, as the Beckers case study shows.
To assess the screen of your own system, watch someone on the team do the task the old way and count the steps. If the new screen takes more steps to reach the same result, the old way keeps winning.
What each person needs to see, and what they don't#
Each role should open the system and find first what it uses to work, without other roles' screens in the way. A screen that shows everything to everyone forces each person to hunt for their part and, when it exposes colleagues' performance, turns into pressure. Designing by role means deciding, for each one, what the first screen is and what stays out of it.
At Fitness Academia, a chain of five gyms in southern Brazil, the sales target lived in a shared spreadsheet that showed every sales rep's performance to every sales rep, and the reps had no screen of their own to see how far they were from the goal. On the platform we built, each rep sees her unit's target and her own contribution to that number, and never sees another unit. The manager sees the whole chain, with the worst-performing unit at the top of the list. The rep's screen shows what she added to the team, without becoming an individual quota.
The sign that it worked showed up in the database. In the weeks after launch, the client created all 15 user accounts for the operation on its own, 5 managers and 10 sales reps, and entered its targets through December inside the tool instead of opening a new spreadsheet tab. The full story is in the Fitness Academia case study.
People outside the company are a role too, and usually the most fragile one. In the audit system we are building, the portal is the only part the audited client will use, to receive requests and send documents. The rule we wrote for that screen says that if requesting and sending documents is confusing, the client goes back to WhatsApp. So the client side uses no audit jargon, accepts several files dragged in at once and highlights the reason a document was sent back.
Roll out alongside the team instead of training after launch#
Rolling out alongside the team means bringing the system into the routine with one of its builders present in the first weeks, watching people work and fixing what gets in the way. Training after launch teaches where to click, but it does not change a screen that takes more work than the old way. Close follow-up finds that screen before the team learns to work around the system.
At Ideal Veículos, a chain of 11 vehicle dealerships, the financing of each sale lived in an Excel spreadsheet that each person filled in their own way. The platform we built was rolled out side by side with the operation, with in-person follow-up, frequent interviews with the team and training sessions to raise day-to-day use. Training came in as part of the rollout, next to the people adjusting the system, and not as a class at the end of the project.
At Reticar, the sales reps' old app froze during sync, and reps were left unable to work. The new app ran next to the old one during testing, with in-person training and a formal feedback round before the switch. The details of that parallel period are in our article on when a legacy system needs to be replaced, and why an app that freezes sends the team back to paper is in what changes when an app has to work without signal.
Two rollout lessons came out of the audit firm project. The first is the timing of the first login. The audited client's account is activated together with the first document request, not when the contract is signed, because activating it earlier creates accounts nobody uses and passwords that expire before first use. That way the client enters the system with a task already in hand.
The second is accepting that the old channel does not disappear on day one. The audited client will keep sending documents by email and WhatsApp for a while. Instead of rejecting that file, the system lets the team attach it to the request it belongs to, recording who uploaded it and which channel it came through.
When we got it wrong: the system nobody used#
A system we delivered never made it into the client's operation: the team's files stayed entirely in their Google Drive folders. The system organized the work differently from the way the team did it, and the mistake was ours, because we designed it without having seen the material the team used every day.
The mismatch was in the unit of work. In the system, a piece of work and the destination it was sent to formed a single record. In the operation, the same piece of work went to different destinations, each submission with its own documents, and the same destination received different pieces of work from the same client. To fit into the system, the team would have had to duplicate records or note somewhere else which version went where. It was simpler to keep working outside it.
We tell this case as a lesson of our own. The way the team organized its work only became clear when we opened the folders it used every day, and that was within our reach from the start. The lesson we took from it applies to any system: before deciding how it groups the work, look at the folders, the spreadsheet or the notebook the team uses and follow someone doing the task from start to finish.
How to tell whether the system is being used#
Use is measured after the system goes live, by checking whether the main task happens inside it, who does it and when, not how many people logged in. Signs of abandonment show up early and almost always in the database itself: accounts created and never used, records entered in bulk at the end of the month, a spreadsheet still going around on the side.
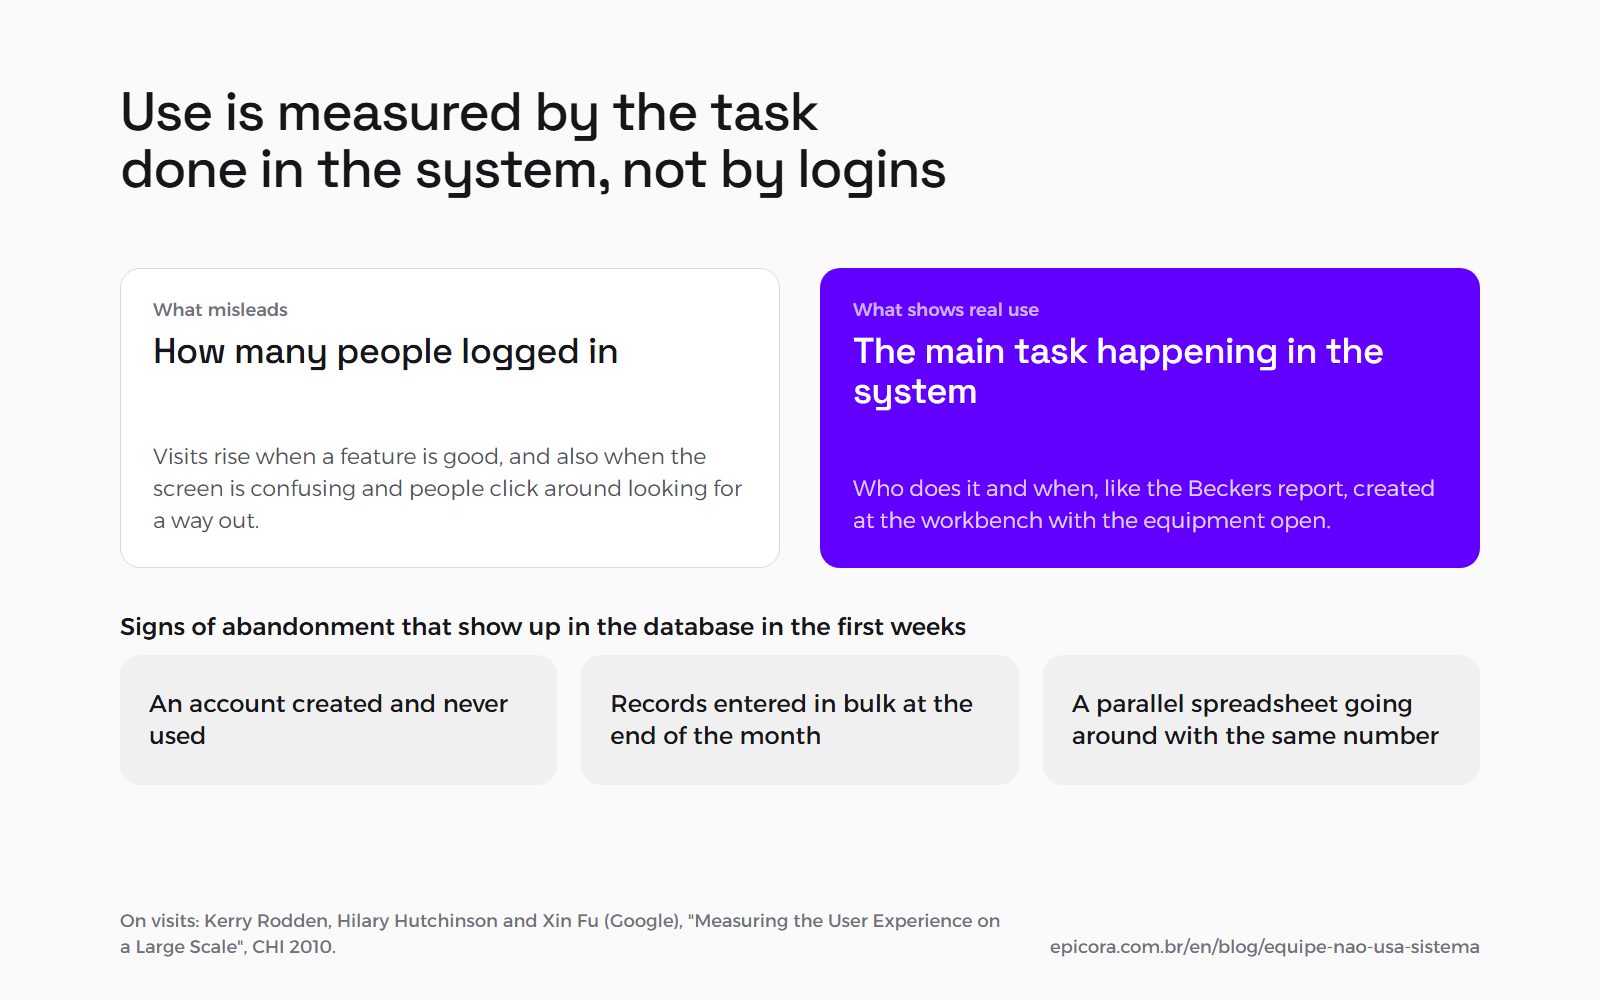
Counting logins is misleading. In a 2010 paper on how Google measures the experience of its own products, Kerry Rodden, Hilary Hutchinson and Xin Fu note that page views for a feature can rise because it is good or because the screen is confusing and people click around looking for a way out. Their approach is to start from the goal, find the behavior that shows whether it was met, and only then pick the number.
In a business system, the goal is almost always that the main task happens in the system when it happens in the real work, like the Beckers maintenance report created at the workbench.
The table gathers the signs of abandonment we see most often and what each one usually points to.
| Sign of abandonment | What usually lies behind it | What to do |
|---|---|---|
| Account created that never logged in | access arrived before there was a task to do | send the access together with the first real task |
| Records entered in bulk at the end of the week or month | the work happens elsewhere and the system became a place to copy things over | bring the screen to where the work happens and redo the screen of the task that repeats |
| A parallel spreadsheet going around with the same number | the system does not show the number that person needs, or shows it with a different rule | give each role a screen with its own number, calculated one single way |
| The same data typed into two systems | the new system does not read from where the data already lives | read from the source instead of asking people to retype |
| Documents and requests arriving on WhatsApp | sending through the system takes more work than sending a message | simplify sending and, meanwhile, attach what arrives outside to the right place |
| Required field filled with a dot or an "x" | the field asks for information the person does not have at that moment | ask for the information at the step where it exists |
| A flag set without the content it stands for | the system asks for a step separate from the work | make the flag a consequence of the work done |
| Logins rising while the main task stalls | people coming in to search, not to work | measure the task completed in the system, not the login |
Almost every row points to the screen or to the timing of access, and none of them is solved by another round of training alone. It is worth checking these signs in the first weeks after launch and again after the first month-end close, with one of the builders and the area manager at the same table.
Frequently asked questions#
Why does a team stop using a new system and go back to spreadsheets?#
Because, on the task it does every day, the system takes more work than the spreadsheet, the notebook or WhatsApp: more fields, more clicks, or data that has to be typed in again. People stick with the path that costs them less time. That is why the fix starts with the screen of the most repeated task, not with pressuring the team.
Does training fix a team that won't use the system?#
Not on its own. Training shows people where to click, but it does not change a screen that takes more work than the old way. It works as part of the rollout, with someone from the team that built the system following the users in the first weeks and fixing what gets in the way, as we did at Ideal Veículos, where the platform was rolled out side by side with the operation.
Should I ban the spreadsheet to force the team to use the system?#
Only after the system does the task with less work than the spreadsheet. Before that, banning the spreadsheet pushes the work onto another side channel, like a notebook or WhatsApp. What usually works is making the system the source of the number the team needs: at Fitness Academia, the sales target started coming from the platform, and the client entered its targets through December inside it.
How do you measure whether a system is actually being used?#
By checking whether the main task happens in the system, who does it and when, not how many people logged in. Accounts created and never used, records entered in bulk at the end of the month and a parallel spreadsheet still going around are the most common signs of abandonment. They show up in the database itself in the first weeks after launch.
Who needs to take part in designing a system so it gets used?#
The people who do the task every day, not only the person who signs the purchase. In an audit system we are building, the person who created the old module pointed to the colleague who runs it today as the one who knows that module's pain points. Outsiders who will use part of the system, like the client who sends documents, also count as a role.
Sources#
- Fred D. Davis, "Perceived Usefulness, Perceived Ease of Use, and User Acceptance of Information Technology", MIS Quarterly, vol. 13, no. 3, September 1989 (two studies with 152 users and four programs; perceived usefulness correlated more strongly with use than ease of use): https://doi.org/10.2307/249008
- Kerry Rodden, Hilary Hutchinson and Xin Fu (Google), "Measuring the User Experience on a Large Scale: User-Centered Metrics for Web Applications", CHI 2010 (the limits of traffic metrics and the method of going from the goal to the number): https://research.google/pubs/measuring-the-user-experience-on-a-large-scale-user-centered-metrics-for-web-applications/
Next step#
If your team went back to spreadsheets after a new system, or you are about to buy one and want it to be used, that is the work we do in custom software. We start with the task that repeats and roll out alongside the team, as we did at Fitness Academia.
Want to look at this in your case?
Tell us in a few lines what you have today. We reply with the path that makes sense, even when the answer is not to build anything.